
USE CASE A: PREVENT DEFECTS & COMPLIANCE ISSUES
Advanced analytics and reporting.
→ Build custom reports and dashboards to visualize and analyze data according to your unique needs, leveraging your data sources as required.
Maximize the data you can get from the system and uncover hidden patterns to increase product quality and safety.
🔎 Metrics to measure: Quality defects, takt time, completion rates, variance 🔍
-
+ Transparent data visualization
Compile the data in your visualization tool of choice and make it available on both the shop floor and the top floor for transparency.
-
+ Compare teams, lines, and sites
Compare the data collected from different teams, lines, or sites OR compare the performance between different checklists over time.
-
+ Corrective measures
Executives, managers, and supervisors can see what’s happening live on the production floor via data. For example: by analyzing a progression of checks.
This helps them take the right corrective measures proactively.
-
+ What data can you pull?
Check out the full list of data parameters you can connect with in our Data Glossary.
USE CASE B: OPTIMIZE RESOURCE ALLOCATION & REDUCE COSTS
Better decision making.
→ Collect insights from users (eg. feedback and sign-off data) in your data visualization tool (like Power BI).
You'll get an overview of all improvement areas reported by frontline workers.
→ You can also use the Data API to build concrete action plans and to-do lists for continuous improvement based on these frontline insights in your task management tool.
🔎 Metrics to measure: Cost per unit produced 🔍
-
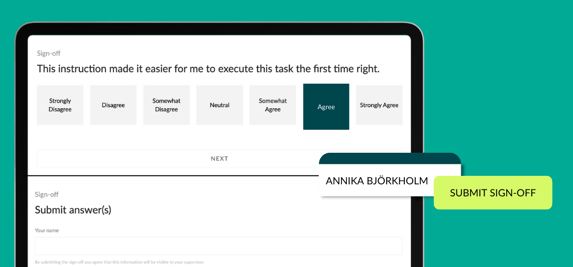
+ What is sign-off data?
= completion forms that can be added to the end of an instruction to answer any question.
-
+ What is user feedback?
= freely formulated improvement suggestions gathered from users through your checklists and instructions.
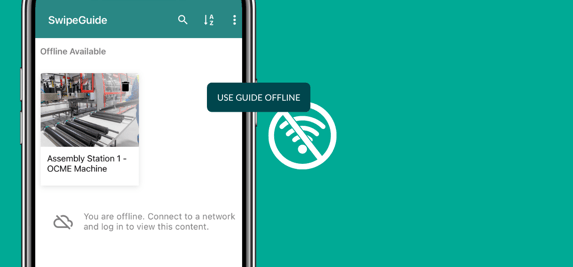
USE CASE C: MINIMIZE REWORK & DOWNTIME
Improve operational efficiency.
→ Use data from SwipeGuide checklists and connect with your visualization tool to get a deeper look at what’s happening and what can be improved.
→ Prevent errors from happening by:
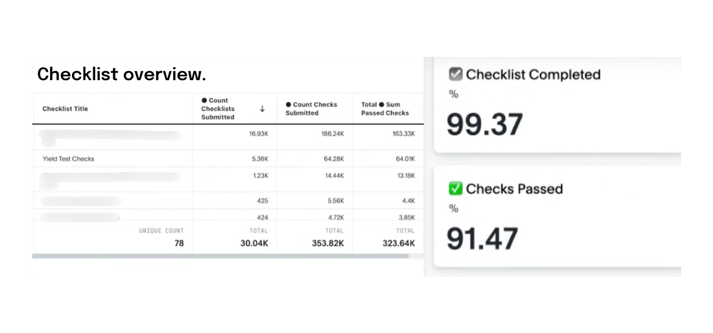
- Tracking checklist completion rates and analyzing pass/fail data.
- Correlating checklist information with e.g. yield metrics to identify areas for improvement.
🔎 Metrics to measure: Mean Time Between Failures (MTBF), Cycle Time, OEE, Number of issues identified proactively 🔍
-
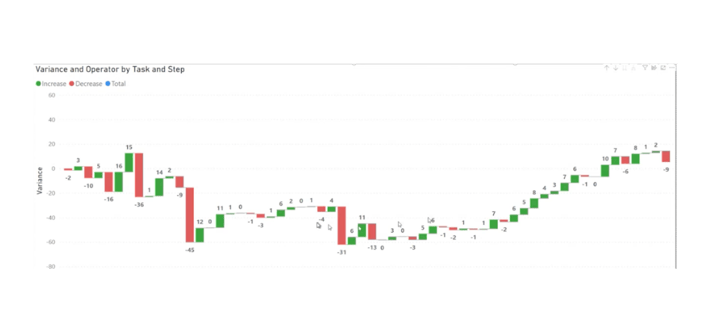
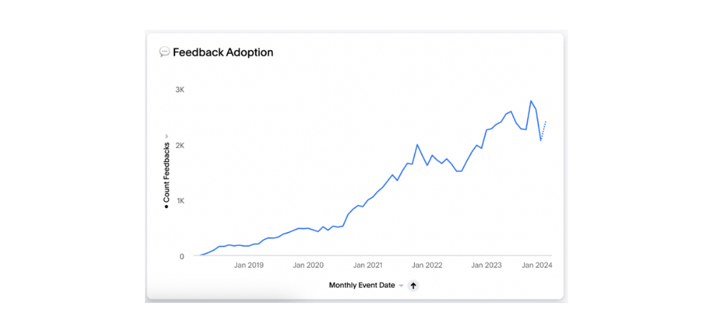
+ View trends across checklists
Want to see how often specific checklist items are being completed over time?
We can create detailed reports showing the frequency of individual checks.
These reports can be presented in easy-to-understand graphs, giving you a clear visual of trends and patterns in your checklist data.
-
+ Adjustment deviations
This data can also help you define guidelines for identifying when adjustments deviate from target ranges and establish protocols for corrective actions and identify potential issues early.
USE CASE D: REDUCE INCONSISTENCIES
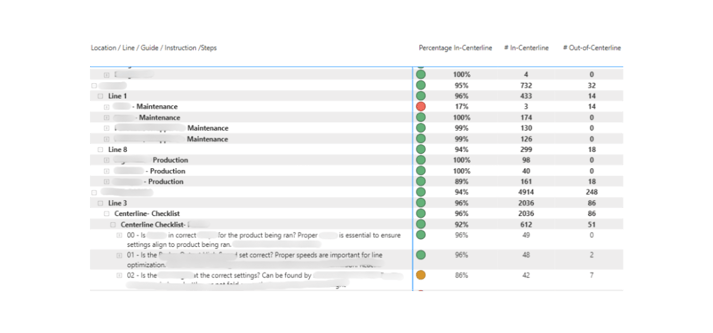
Centerlining for consistent operations.
→ Build performance-focused activity reports in e.g. PowerBI that highlight in-centerline percentages per:
- location or checklist
- completion rates
- submission rates
- feedback received
→ Centerlining promotes consistent operations and line optimization. It’s a fantastic way to establish target ranges for optimal equipment performance based on data coming from checklists and equipment.
🔎 Metrics to measure: Adherence to standard, Checklist completion rate, Pass/Fail rate consistency
-
+ Identify critical adjustment points
Centerlining can also help you identify critical adjustment points, eliminate unnecessary ones, and implement controls to reduce errors and improve efficiency.
-
+ Example questions: Centerline checklist
- Is the [machine part] set correctly for the product to be run? → Yes/No
- Is the [speed type] set correctly? → Yes/No
- Are the correct [parts] installed for configuration in [line section]? → Yes/No
- Are all [sensors] at the [line section] aligned and working properly? → Yes/No